
” Aboriginal and Torres Strait Islander people suffer a disproportionate burden from communicable diseases (diseases that can be transmitted from person to person), with rates of hospitalisation and illness due to these conditions many times higher than other Australians.1
Part 2 below presents results for children who were identified as Aboriginal and/or Torres Strait Islander on the AIR. “
In 2015–16, Aboriginal and Torres Strait Islander children aged 5 had an even higher national immunisation rate of 94.6%. However, there was wider variation across PHN areas, ranging from 98.8% in the Gold Coast (Qld) to 89.4% in Western Victoria.”
Download Healthy Communities:
See Previous NACCHO Aboriginal Health and #WorldImmunisationWeek : @healthgovau Vaccination for our Mob
Part 1 Overview MORE INFO HERE
Immunisation is a safe and effective way to protect children from harmful infectious diseases and at the population level, prevent the spread of these diseases amongst the community.
Australia has generally high immunisation rates which have increased steadily over time, but rates continue to lag in some local areas.
This report focuses on local area immunisation rates for children aged 5 and shows changes in immunisation rates over time. It also presents 2015–16 immunisation rates for all children and Aboriginal and Torres Strait Islander children aged 1, 2 and 5.
Results are presented for the 31 Primary Health Network (PHN) areas. Where possible they are broken down into smaller geographic areas, including for more than 300 smaller areas and across Australian postcodes.

Further detailed rates are available in the downloadable Excel sheet and a new interactive web tool allows users to compare results over time by geography and age group.
This local-level information assists professionals to use their knowledge and context for their area, to target areas in need and develop effective local strategies for improvement.
The report finds:
- Since 2011–12, childhood immunisation rates have improved nationally and across smaller areas, for all children and for Aboriginal and Torres Strait Islander children. Variation in rates still exists across local areas, however the gap between those areas with the highest and lowest rates is diminishing
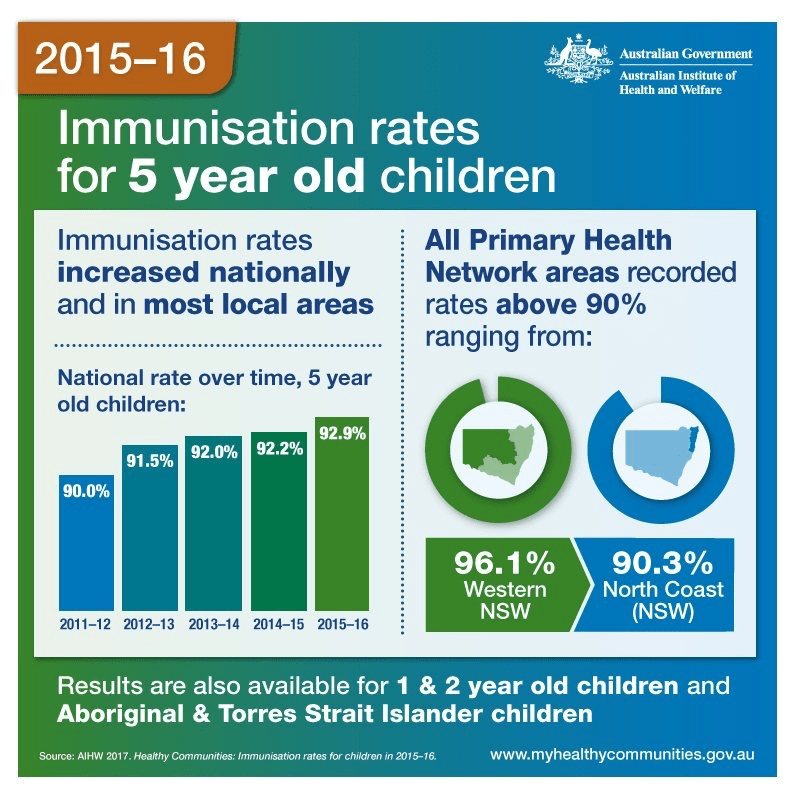
- Nationally 92.9% of all children aged 5 were immunised in 2015–16. All PHN areas achieved an immunisation rate of 90% or more, ranging from 96.1% in Western NSW to 90.3% in North Coast (NSW).
Summary
In 2015–16, childhood immunisation rates continued to improve nationally and in most local areas. Although rates vary across local areas, the gap in rates between the highest and lowest areas is diminishing.
This report focuses on immunisation rates for 5 year olds and presents results since 2011–12. It also provides the latest information for 1, 2 and 5 year olds for Australia’s 31 Primary Health Network (PHN) areas and smaller local areas.
From 2011–12 to 2015–16, there were notable improvements in rates for fully immunised 5 year olds. National rates increased from 90.0% to 92.9%. Rates increased for PHN areas too, as all areas reached rates above 90% in 2015–16.
Rates in smaller local areas (Statistical Areas Level 3, or SA3s) have also improved. In 2015–16, 282 of the 325 local areas had rates of fully immunised 5 year olds greater than or equal to 90%. This is up from 2011–12 when only 174 areas had rates in this range. Further, the difference in rates between the highest and lowest areas has decreased over time (Figure 1).
In 2015–16, the rate of fully immunised children varied across PHN areas for the three age groups:
- 1 year olds – 95.0% to 89.8% (national rate 93.0%)
- 2 year olds – 93.2% to 87.2% (national rate 90.7%)
- 5 year olds – 96.1% to 90.3% (national rate 92.9%).
Part 2 Aboriginal and Torres Strait Islander children
Aboriginal and Torres Strait Islander people suffer a disproportionate burden from communicable diseases (diseases that can be transmitted from person to person), with rates of hospitalisation and illness due to these conditions many times higher than other Australians.1
This section presents results for children who were identified as Aboriginal and/or Torres Strait Islander on the AIR. These data are based on Medicare enrolment records.
For Aboriginal and Torres Strait Islander children, national immunisation rates in 2015–16 for 1 and 2 year olds were lower than the rates for all children (89.8% compared with 93.0% for 1 year olds, and 87.7% compared with 90.7% for 2 year olds).
In contrast, the national immunisation rate for Aboriginal and Torres Strait Islander children aged 5 years was higher than the rate for all children (94.6% compared with 92.9%).
Primary Health Network areas
In 2015–16, the percentages of fully immunised Aboriginal and Torres Strait Islander children varied across PHN areas for all three age groups as shown in Figure 6. The range in immunisation rates across PHN areas for the three age groups is outlined below.
- 1 year olds – 94.2% in Tasmania to 76.1% in Perth North (WA)
- 2 year olds – 93.4% in South Western Sydney (NSW) to 76.0% in Perth South (WA)
- 5 year olds – 98.8% in Gold Coast (Qld) to 89.4% in Western Victoria.
Statistical Areas Level 4 (SA4s)
For Aboriginal and Torres Strait Islander children, Statistical Areas Level 4 (SA4s) were used instead of SA3s as the smallest geographic areas. There are larger populations in SA4s and this allows more reliable reporting for smaller population groups such as Aboriginal and Torres Strait Islander children.
Across more than 80 SA4s, the percentage of Aboriginal and Torres Strait Islander children fully immunised in 2015–16 varied considerably:
- 1 year olds – ranged from 95.9% in Central Coast (NSW) to 72.4% in Perth–North West (WA)
- 2 year olds – ranged from 96.0% in Coffs Harbour–Grafton (NSW) to 71.2% in Perth–South East (WA)
- 5 year olds – ranged from 100% in Murray (NSW) to 87.6% in Perth–South East (WA).
Figure 6: Percentage of Aboriginal and Torres Strait Islander children fully immunised and numbers not fully immunised, by Primary Health Network area, 2015–16

| Primary Health Network | 1 year | 2 years | 5 years | No. not fully immunised (1, 2, & 5 years combined) |
|---|---|---|---|---|
| Gold Coast (Qld) | 91.6% | 88.1% | 98.8% | 40 |
| Nepean Blue Mountains (NSW) | 92.5% | 89.0% | 97.5% | 46 |
| South Eastern NSW) | 91.6% | 90.8% | 97.1% | 100 |
| Hunter New England & Central Coast (NSW) | 93.8% | 91.3% | 96.5% | 276 |
| Western NSW | 90.4% | 88.0% | 96.3% | 215 |
| Northern Queensland | 87.0% | 88.2% | 96.1% | 554 |
| Murrumbidgee (NSW) | 92.5% | 88.4% | 95.8% | 67 |
| Country SA | 91.2% | 86.6% | 95.8% | 102 |
| North Western Melbourne (Vic) | 90.2% | 84.7% | 95.6% | 76 |
| Country WA | 87.6% | 88.1% | 95.6% | 345 |
| Tasmania | 94.2% | 90.0% | 95.5% | 84 |
| Murray (Vic & part NSW) | 88.6% | 88.6% | 95.3% | 114 |
| North Coast (NSW) | 92.1% | 90.8% | 95.3% | 141 |
| South Eastern Melbourne (Vic) | 93.1% | 88.0% | 94.6%# | 35 |
| Northern Territory | 93.0% | 87.9% | 94.1% | 324 |
| Brisbane South (Qld) | 86.7% | 88.5% | 94.0% | 176 |
| South Western Sydney (NSW) | 91.6% | 93.4% | 93.8% | 65 |
| Gippsland (Vic) | 91.7% | 86.8% | 93.8% | 32 |
| Western Queensland | 87.4% | 86.0% | 93.3% | 114 |
| Brisbane North (Qld) | 89.3% | 88.8% | 93.1% | 155 |
| Central Qld, Wide Bay & Sunshine Coast | 89.1% | 85.2% | 92.9% | 262 |
| Eastern Melbourne (Vic) | 90.7% | 90.1% | 92.8% | 39 |
| Western Sydney (NSW) | 87.9% | 84.7% | 92.8% | 98 |
| Adelaide (SA) | 90.3% | 84.6% | 92.7% | 142 |
| Darling Downs & West Moreton (Qld) | 89.8% | 86.3% | 92.2% | 227 |
| Australian Capital Territory | 93.5% | 83.6% | 91.4% | 42 |
| Central & Eastern Sydney (NSW) | 92.7% | 88.3% | 90.8% | 60 |
| Perth North (WA) | 76.1% | 80.1% | 90.1% | 194 |
| Perth South (WA) | 81.1% | 76.0% | 89.6% | 252 |
| Western Victoria | 93.8% | 86.2% | 89.4% | 53 |
| Northern Sydney (NSW) | 97.2%# | 94.3%# | 87.5%# | 7 |
| National results | 89.8% | 87.7% | 94.6% | 4,438 |
# Interpret with caution: This area’s eligible population is between 26 and 100 registered children.
Notes
- Components may not add to totals due to rounding.
- Data are reported to one decimal place, however for graphical display and ordering they are plotted unrounded.
- These data reflect results for children recorded as Aboriginal and Torres Strait Islander on the AIR. Levels of recording may vary between local areas.
Source Australian Institute of Health and Welfare analysis of Department of Human Services, Australian Immunisation Register statistics, for the period 1 April 2015 to 31 March 2016, assessed as at 30 June 2016. Data supplied 2 March 2017.
ADDED June14
Influenza Vaccination During Pregnancy
Vaccination remains the best protection pregnant women and their newborn babies have against influenza.
Despite influenza vaccination being available free to pregnant women on the National Immunisation Program, vaccination rates remain low with only 1 in 3 pregnant women receiving the influenza vaccine.
Influenza infection during pregnancy can lead to premature delivery and even death in newborns and very young babies. Pregnant women can have the vaccine at any time during pregnancy and they benefit from it all through the year.
Health professional:
- Flu vaccination and pregnancy – Free flu shots for pregnant women https://youtu.be/IhUoMPPGgZA
Pregnant women:
- Flu vaccination and pregnancy – What pregnant women need to know https://youtu.be/7m0M_rFIhFY
- Flu vaccination and pregnancy – Vaccinate against flu. Protect your baby too https://youtu.be/9nWb6daxfEY